Exploring SFPD Dispatch Data
The SFPD Dispatch dataset contains emergency dispatch information for 10,000 emergency calls from January 2018. This site highlights some findings from this dataset, and attempts to use these findings to outline solution steps to improve emergency response across San Francisco. All data analysis code used can be found in the Jupyter Notebook linked to in the top right.
Let's start with the fundamental questions:
Which areas had the most emergencies?
→ Here's a sorted bar plot of frequency by zipcode:
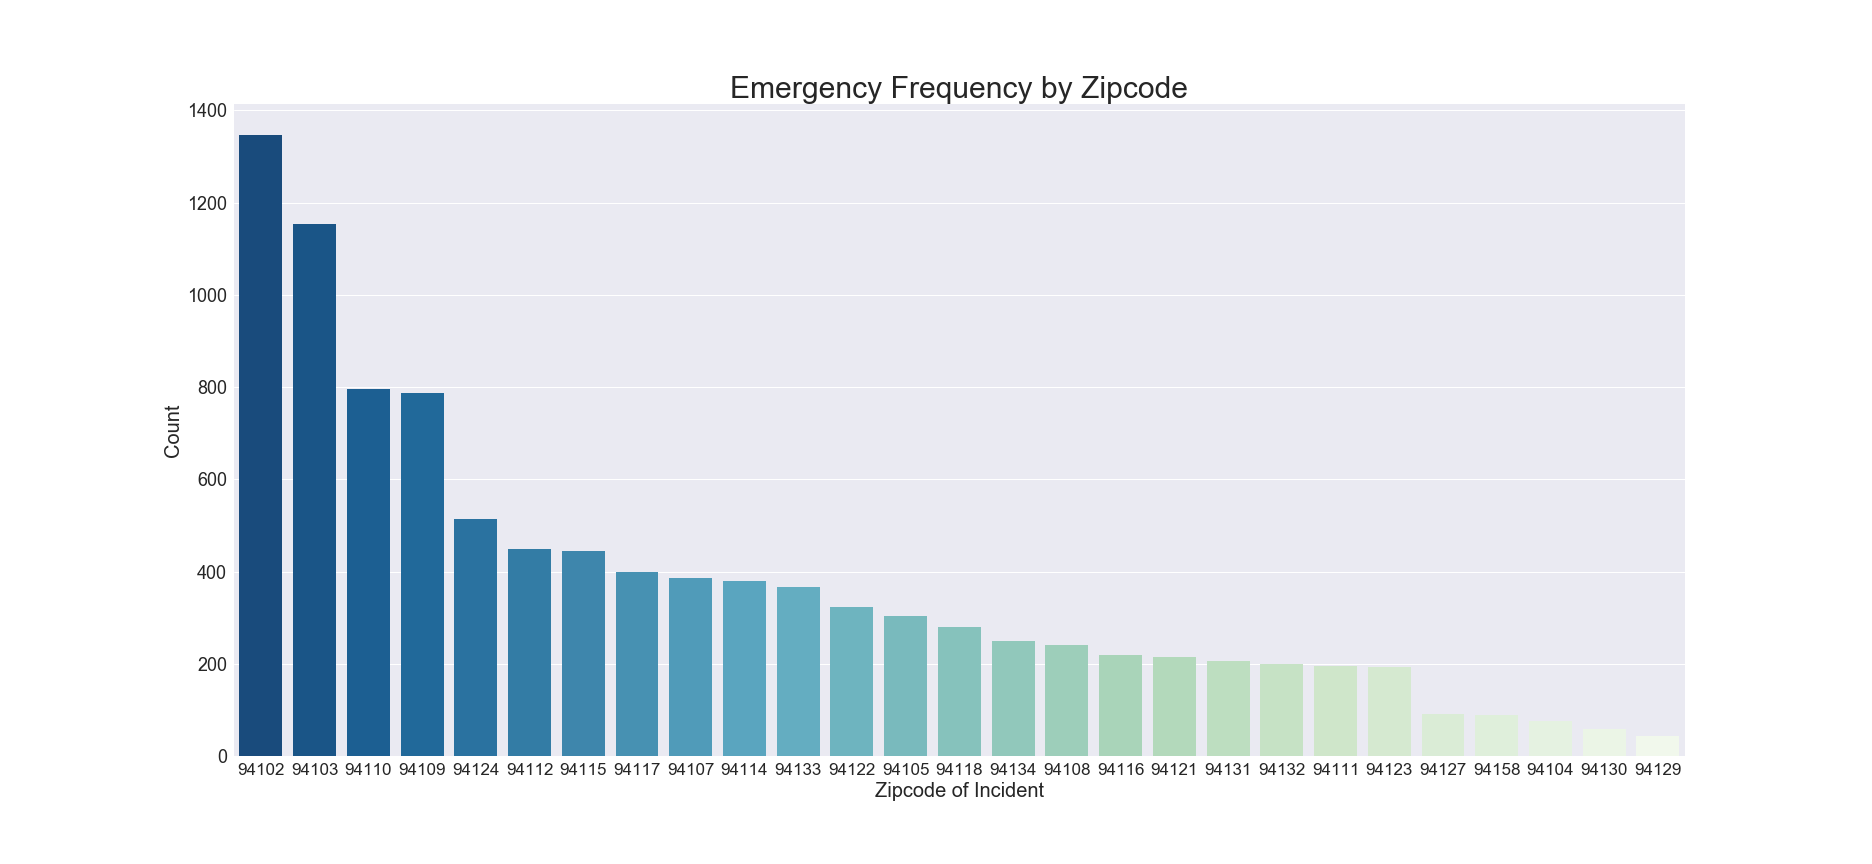
More on locational data can be found in Crime Correlation.
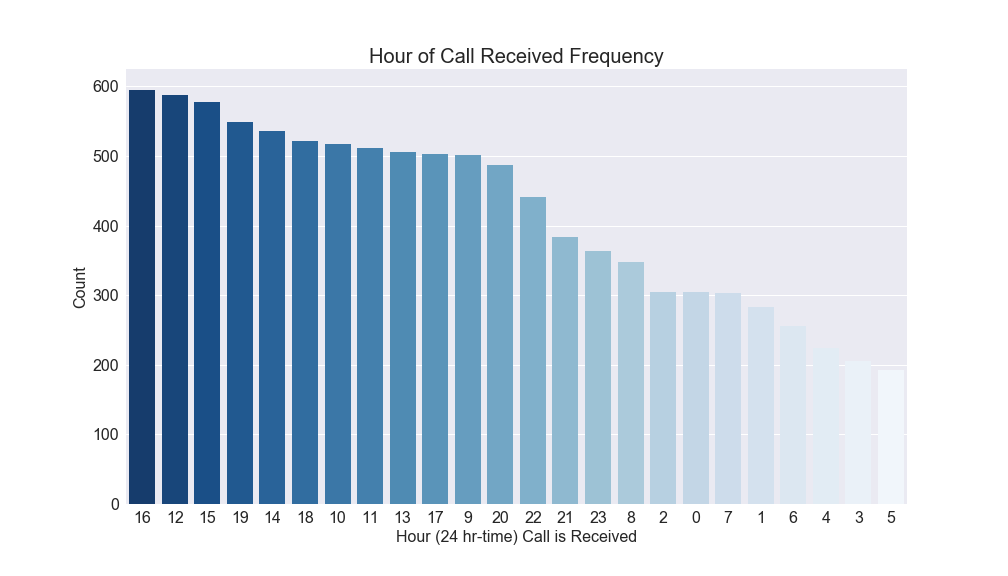
Which times of the day had the most emergencies?
→ Hours in the late afternoon and evening have the most emergencies (this is 24 hour time, so '16' represents 4 PM):
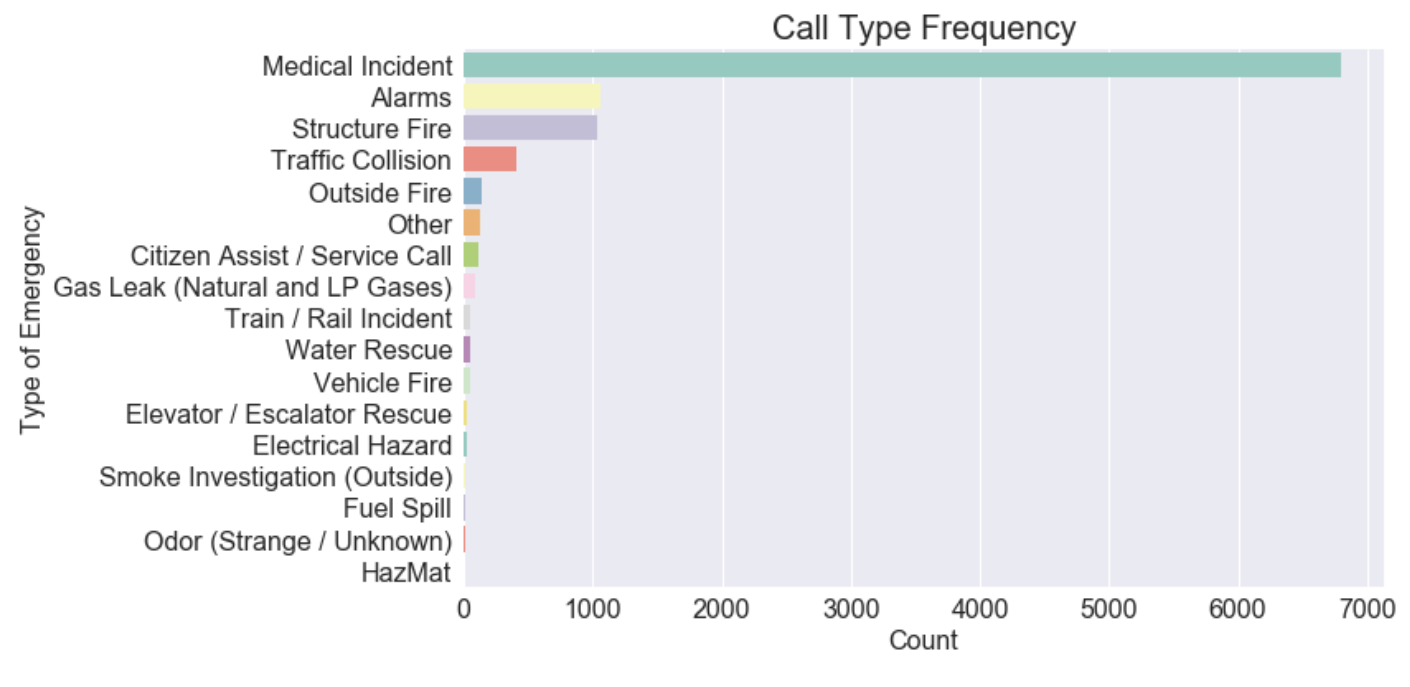
What is the most common type of emergency?
→ Medical incidents, by a long shot.
Trends
1. The Effect of Location
Which places in SF take the longest for emergency responders to reach?
Here we plot the median of the time difference between when the call is received and when the responders arrive on scene of the incident, the "response time". Median is used here because it is robust to possible outliers.
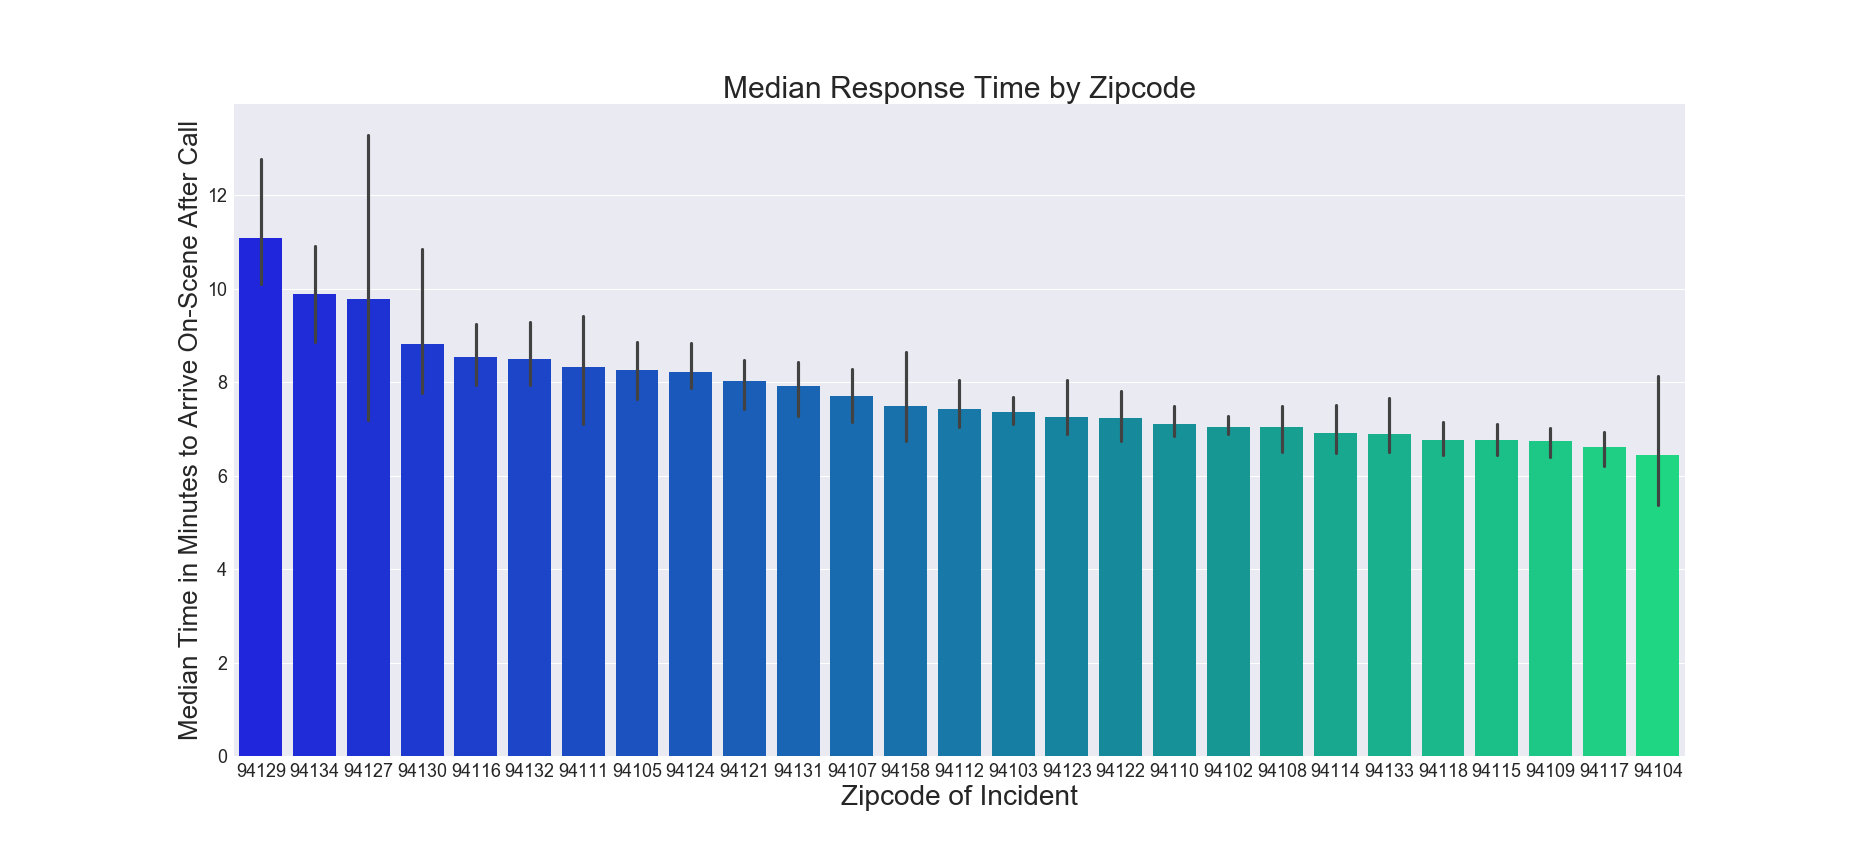
Highest Median Response Times By Zipcode
| Zipcode | First | Second | Third |
|---|---|---|---|
| Zipcode: Median Response Time | 94129: 11.1 Minutes | 94134: 9.9 Minutes | 94127: 9.78 Minutes |
Outliers can be important though, so we'll do them next.
It's interesting to see that when means are used instead of medians, we see very different plot:
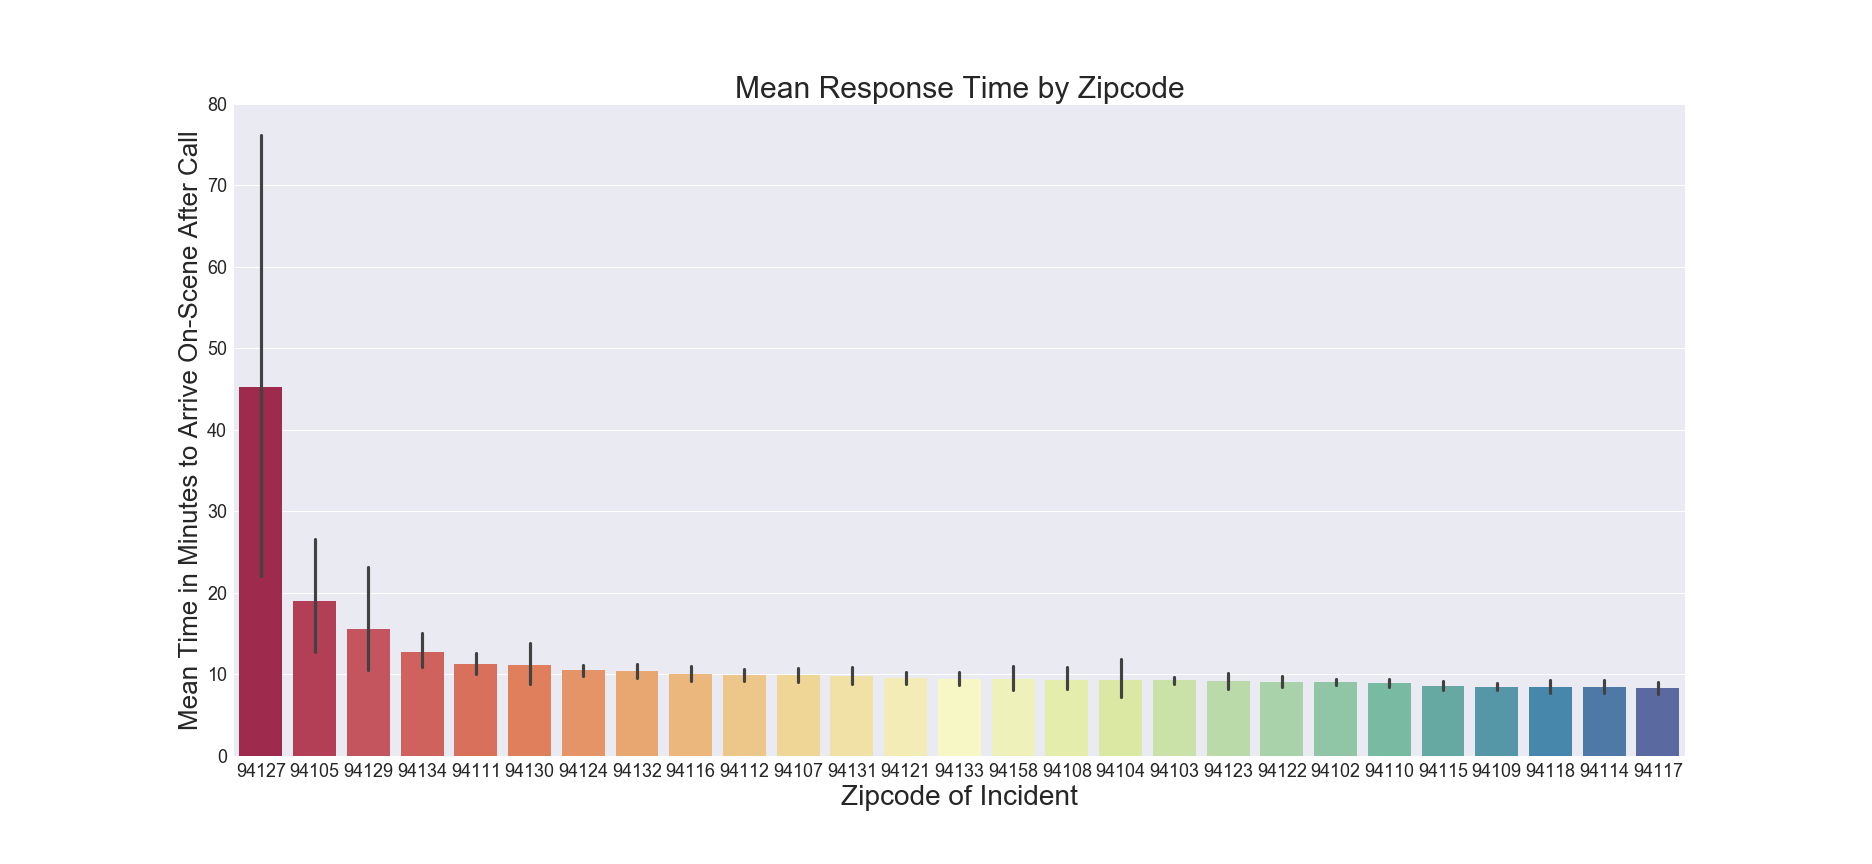
Highest Average (Mean) Response Times By Zipcode
| Zipcode | First | Second | Third |
|---|---|---|---|
| Zipcode: Mean Response Time | 94127: 45.32 Minutes | 94105: 19.02 Minutes | 94129: 15.55 Minutes |
This is strange- what's going on zipcode 94127? It seems to have an absurdly high response time on average- its population is just 20,624, so it's definitely not overcrowded. It's also the wealthiest zipcode in our study, with a median household income of $95,313, which makes this even stranger.
Let's take a look at a terrain map of San Francisco - zipcode 94127 is shown highlighted in red:
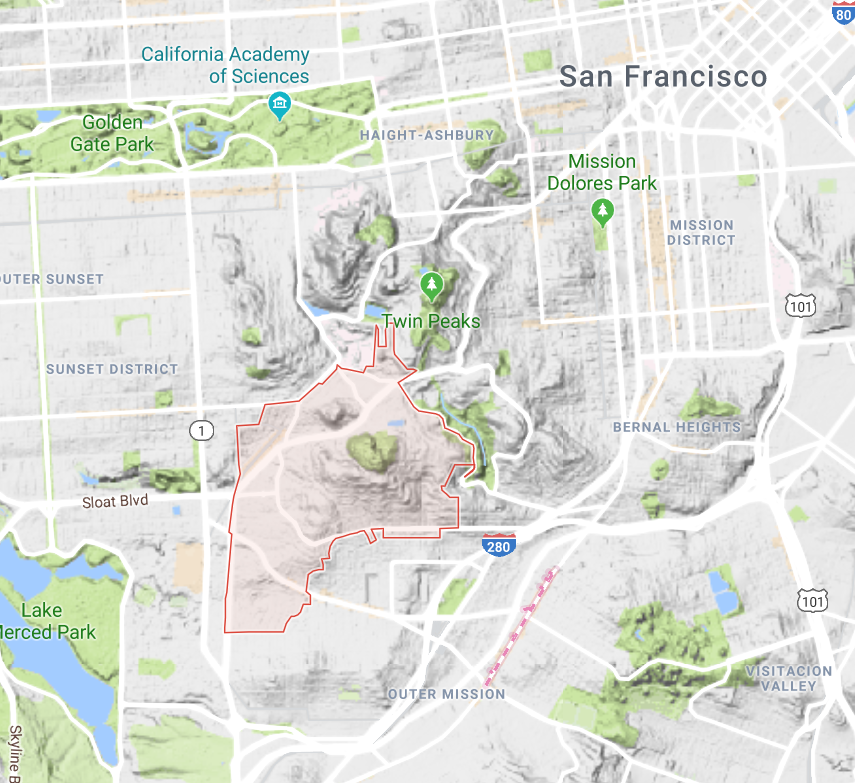
It turns out that 94127 is almost completely enclosed by mountainous terrain, and contains some itself. This definitely adds complexity in physically reaching emergencies in 94127- more mountainous land can mean more detours, more roundabout roads, and on average a longer and slower-speed trip than a flatter region. This can help explain why we see a lot of extremely high response time outliers when considering this zipcode, which explains the vast difference between the mean, which is sensitive to outliers, and the median.
For the other zipcodes whose means differed, 94104, 94108, 94111, and 94133 officially make up SF's crowded Financial District, home to the city's largest concentration of corporate headquarters, firms and financial institutions. 94102, 94103, 94105 and 94111 are in crowded downtown San Francisco, at or near the Financial District. For these zipcodes, high amounts of traffic can possibly be impacting response time, increasing the variance and mean. We'll explore zipcode 94129 more in Dispatch Time.
2. The Effect of Time of Day
Which times of the day are emergency responders slower to react to dispatch alerts?
→ Emergency responders had the lowest expected delay in marking themselves "en route" for emergency dispatches during evening, and naturally seemed to have the most lag during night hours.
Here's the distribution of the time difference between the moment the operator dispatches the unit and when the unit reports that it is en route, for these two chunks of the day.
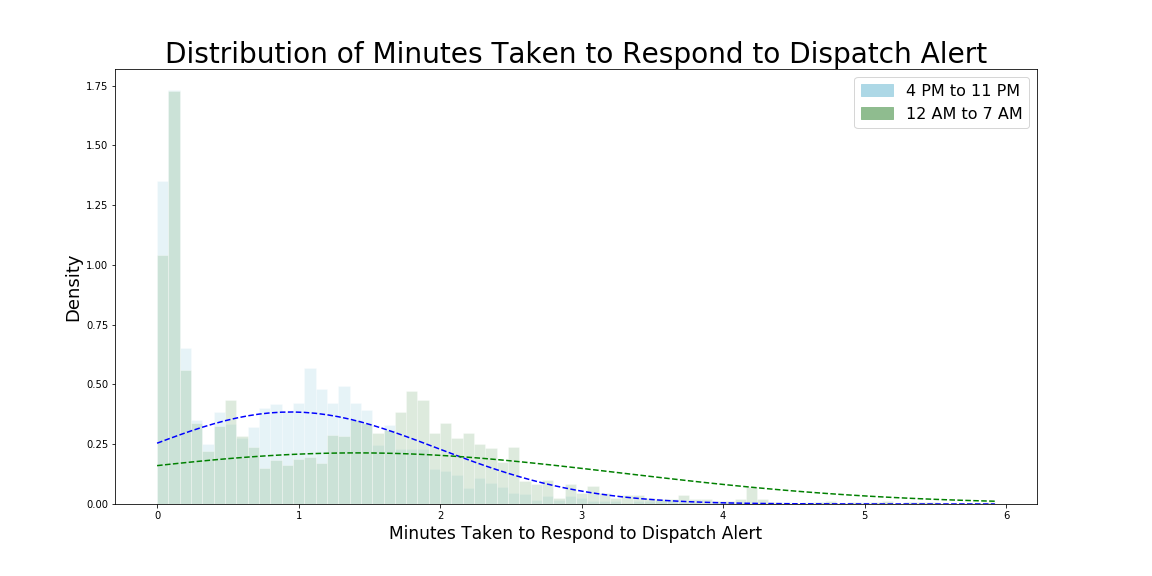
→ The distribution suggests late night hours (12 AM to 7 AM) have greater density towards the higher times, indicating slower response overall.
This is also indicated by a box-and-whisker plot of the distribution of times for each day portion:
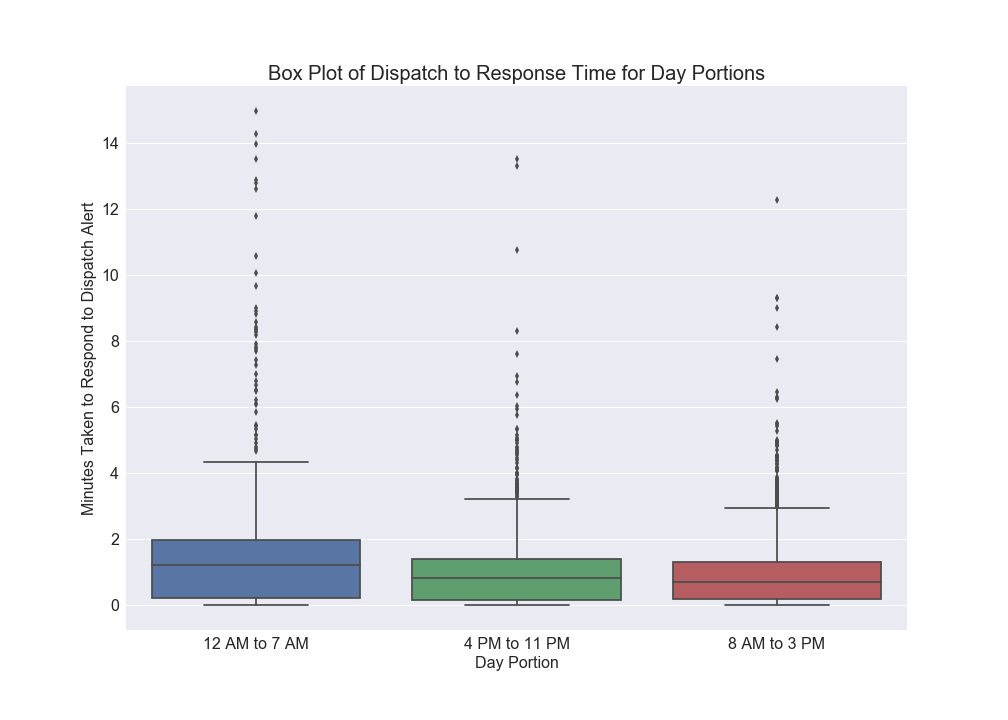
Two measures of central tendency, the mean and the median (used because it is robust to outliers), are shown below:
Average Time to Respond to Dispatch Alert for Portions of Day
| Portion of Day | Mean Time to Respond | Median Time to Respond |
|---|---|---|
| Morning to Late Afternoon (8 AM to 3 PM) | 1.25 min | 0.70 min |
| Evening Hours (4 PM to 11 PM) | 0.94 min | 0.83 min |
| Night Hours (12 AM to 7 AM) | 1.41 min | 1.23 min |
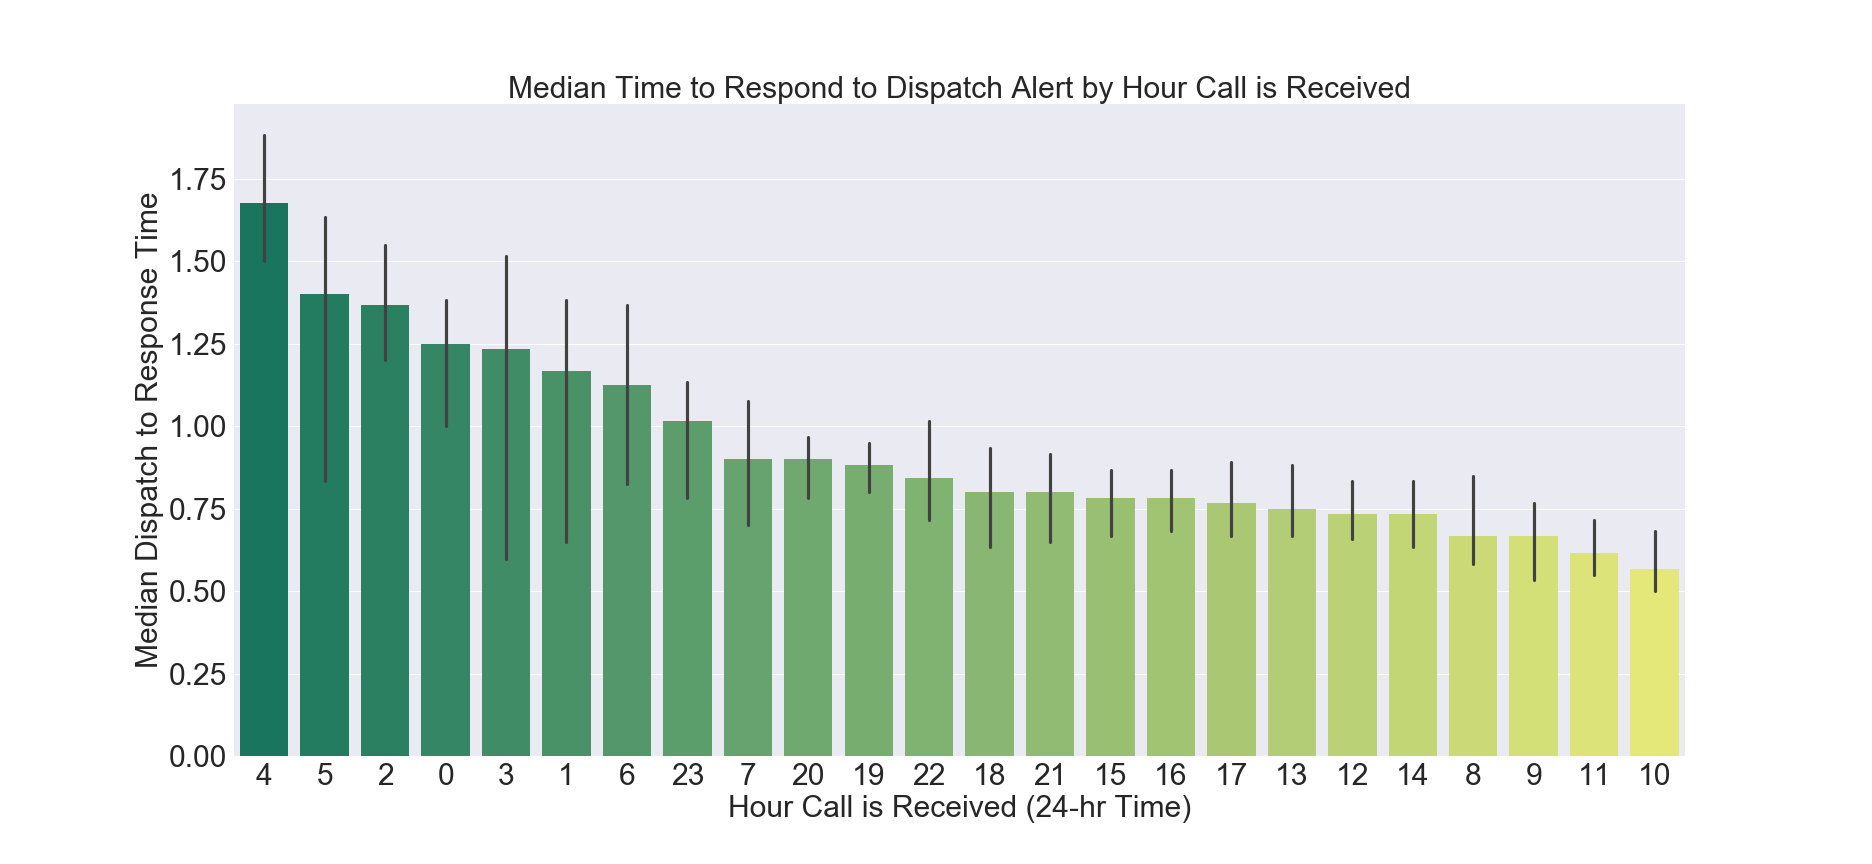
Plotting this time difference by specific hour, it makes it clear that night hours are hardest on emergency responders (this is 24 hour time- 0 is midnight, 4 represents 4 AM, 5 is 5 AM, etc.):
3. The Effect of Income
How does the response and arrival time differ for wealthier and poorer areas?
To answer this, we consult outside data on median household incomes for SF zipcodes. We can categorize each zipcode into quartiles of annual household income: 0 - $25k, $25k - $50k, and so on.
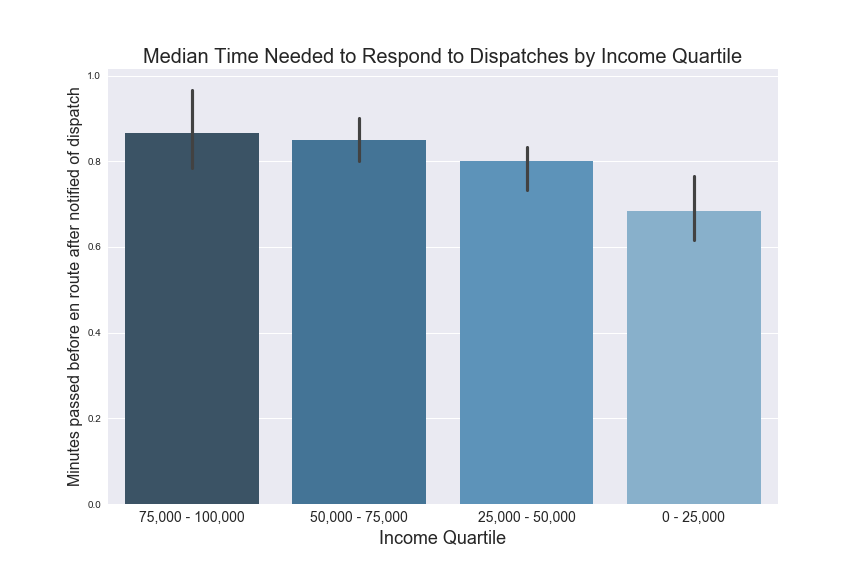
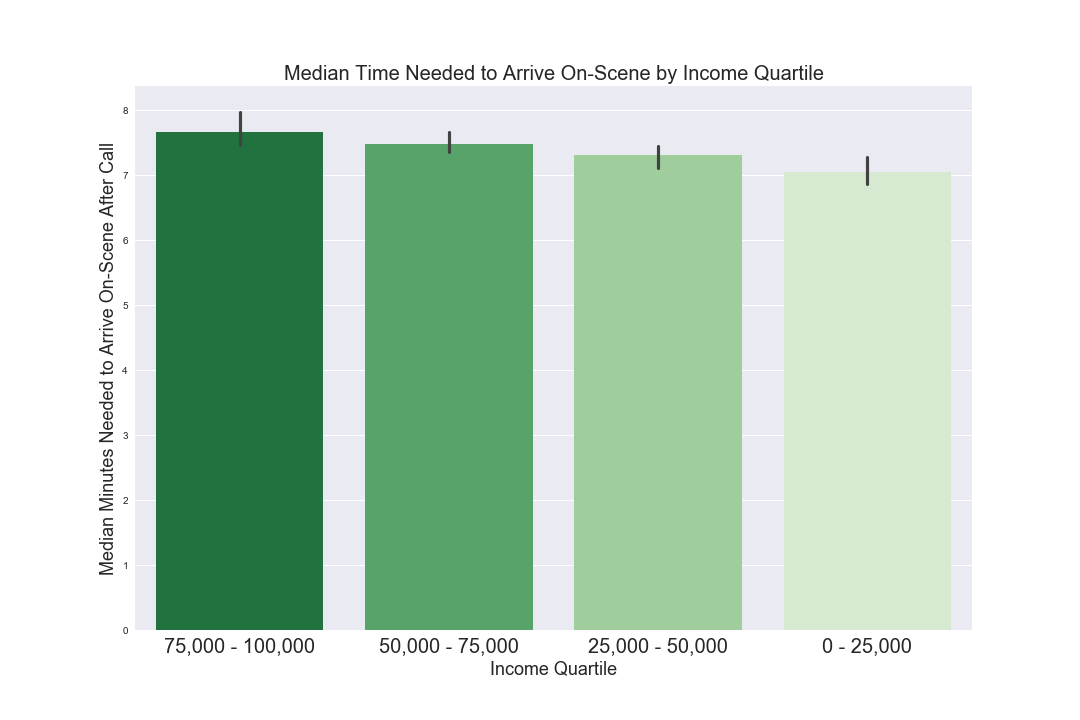
→ We find that emergency responders in SF actually take longer to both react to dispatches to wealthier zipcodes and to arrive on scene to their emergencies. This was surprising, especially after reading studies such as this and this.
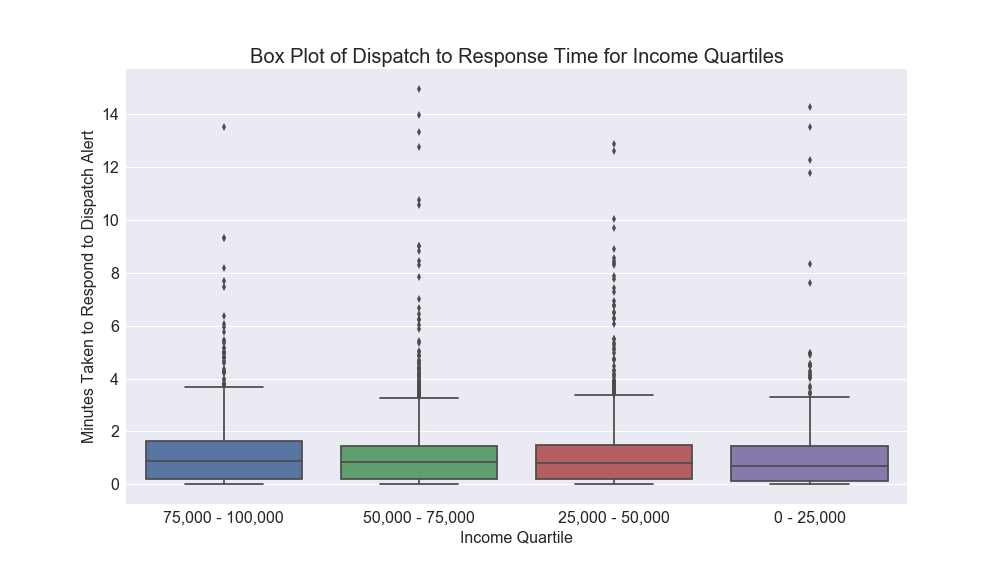
Here are boxplots of the time in minutes needed for responders to declare that they're en route to the emergency, for each income quartile:
Here's the median time (robust to outliers) needed for responders to declare that they're en route by income quartile:
Here's the median time needed for responders to arrive on scene to the emergency:
Shamikh Hossain
Contact information: ssh50@duke.edu