Preparing for the Future
Which areas are experiencing the greatest increase in dispatch calls?
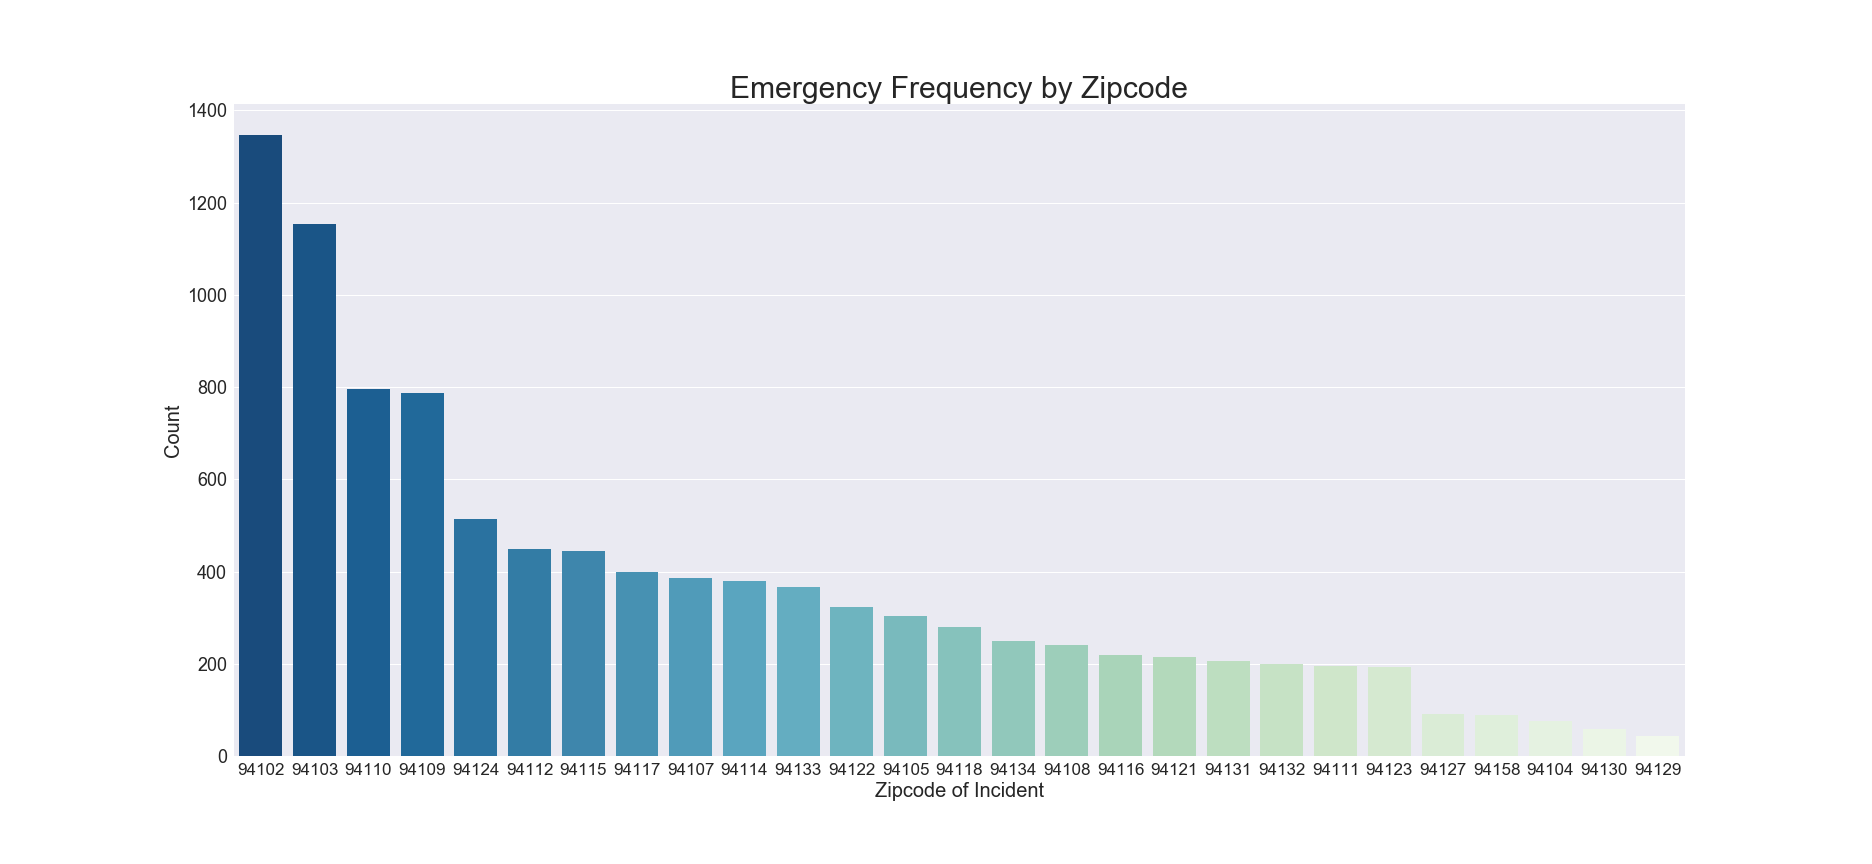
The dataset spans from January 13th to January 24th, and thus it's difficult to measure change in number of calls over this small time period, especially as we can see that the areas with the most calls consistently dominate the top of the charts.
For example, zipcodes 94102, 94103 and 94109 had the most emergency calls on January 13th, the earliest day in the data, and also had the most on January 24th, the last day included in the dataset.
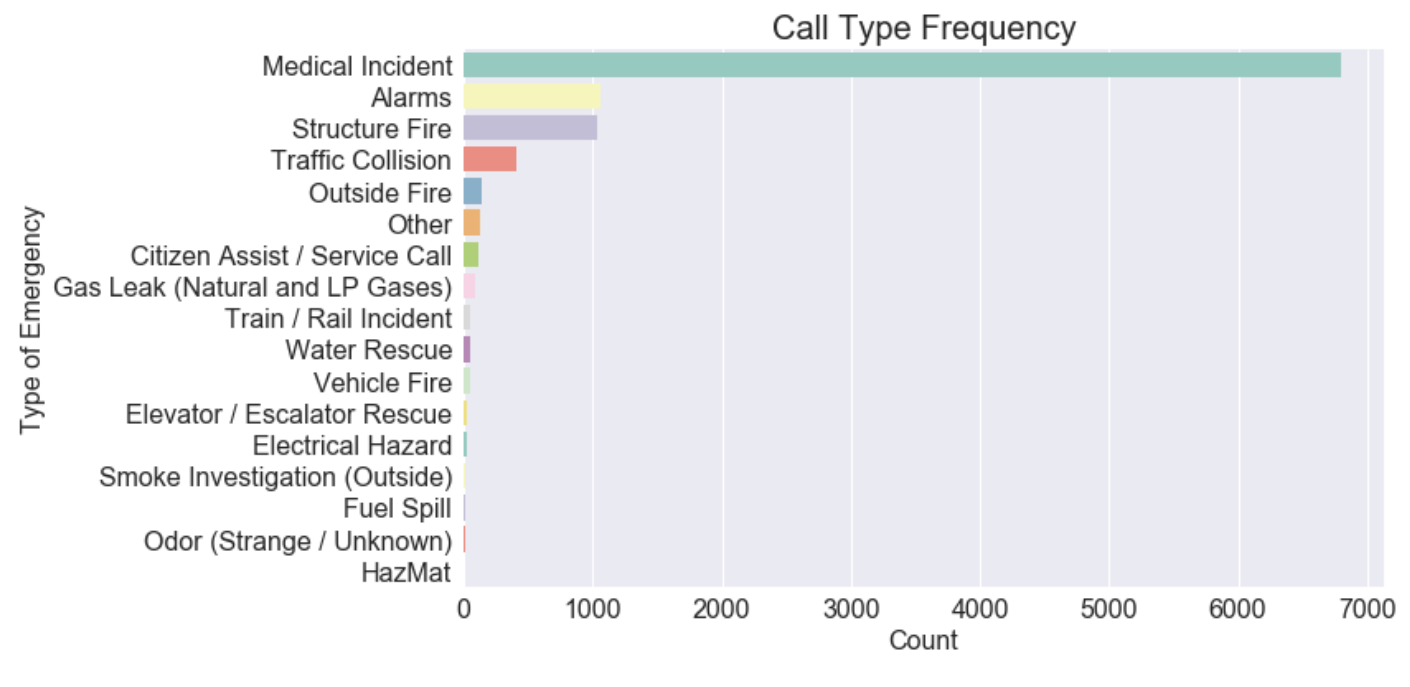
We can, however, look into these frequencies to understand what the most common issues are.
1. Medical emergencies are the issue the overwhelming majority of the time, and its proportion is much greater than the subsequent emergencies.
2. For any given region, medical emergencies are most prominent and almost always followed by structure fires, alarms, and traffic collisions; their order can vary by area. Together, medical emergencies, fires (outside and structural), alarms, and traffic collisions account for more than 94% of all emergency calls in January. Hence, these are the emergencies we should focus our analysis on:
Where and what type of dispatch service would help with the rate of increasing calls?
The elephant in the room - medical incidents
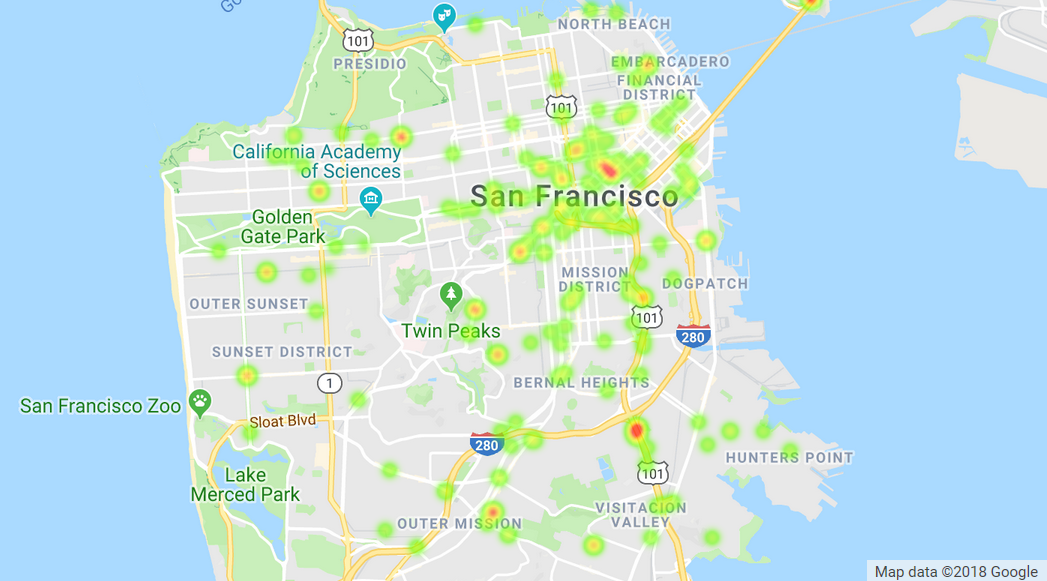
Emergency medical responders should always wary of highly urban areas, as the following medical emergency heatmap shows:
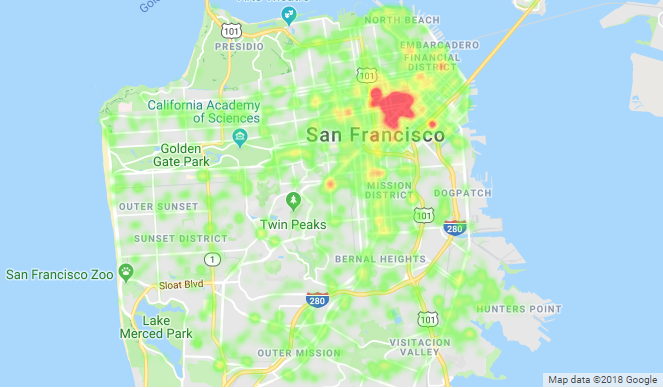
They should especially focus on Mid Market and the Civic Center, which have an especially high concentration of medical emergencies. These are contained in the area circled below.
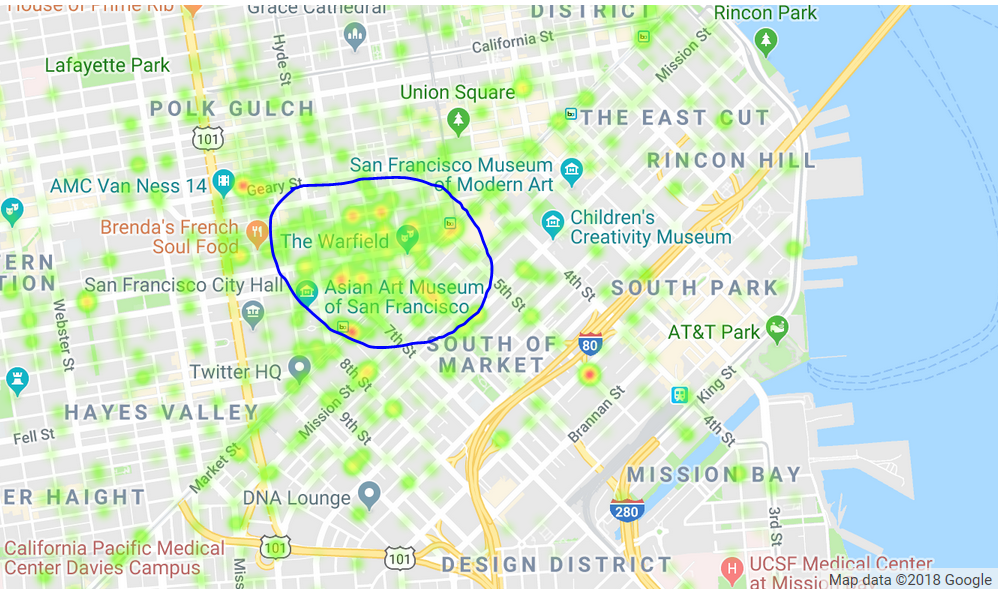
These areas are within the two side-by-side zipcodes 94102 and 94103, that together accounted for 27% of all medical emergency calls in the month of January. Including the nearby 94109 and 94110 raises this to 43% of all medical incidents.
→ Thus, I would set up a medical dispatch service specific to these zipcodes to better cater the high proportion of medical incidents. It is very much imperative to ensure that all units dispatched in these zipcodes contain ALS (advanced life support) resources and paramedics, as for every single one of these four districts, medical emergencies represent at least 70% of all emergencies if not more.
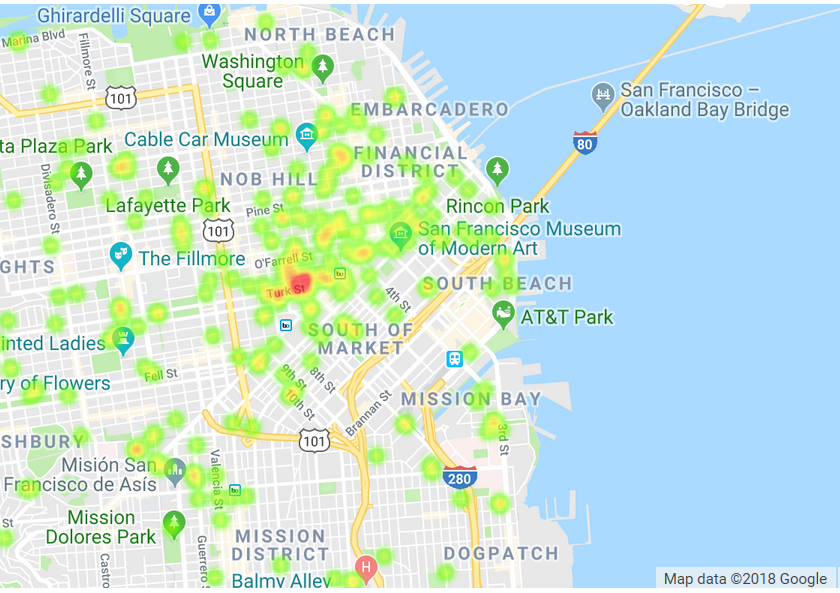
These four zipcodes - 94102, 94103, 94109, and 94110 also account for 37% of all alarms in San Francisco, and this heatmap shows the high concentration of alarms in 94102 (which had both the most medical incidents and the most alarms, with 94103 having the second most in both cases.)
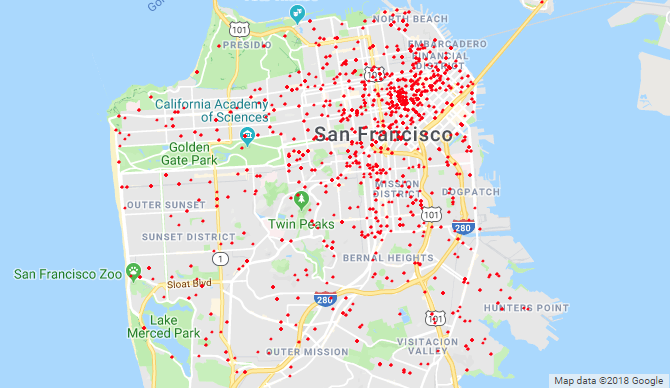
Emergency responders should also expect most fires- even outside ones- to come from urban areas, as symbol maps of fires indicate. Zipcode 94102 had the most structure fires in the month of January, representing almost 19% of all fire calls. 94103 again shows up having the third highest, with 8.3%. Special fire dispatch services for this area would thus be useful.
All Fires
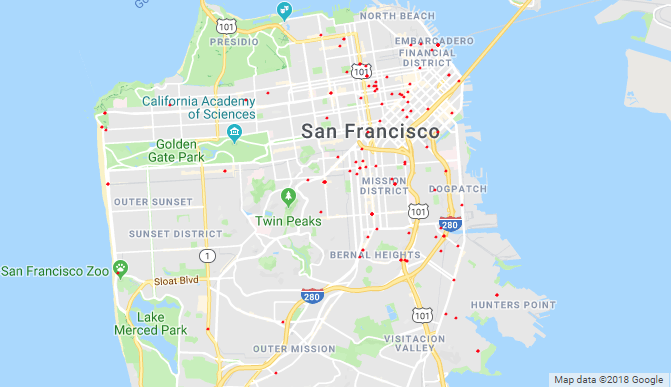
Outside Fires
A heatmap of traffic collisions highlights some specific areas that responders should be wary of, such as the intersection of Highway 101 and Silver Avenue, and several areas on 7th Street and the South of Market.
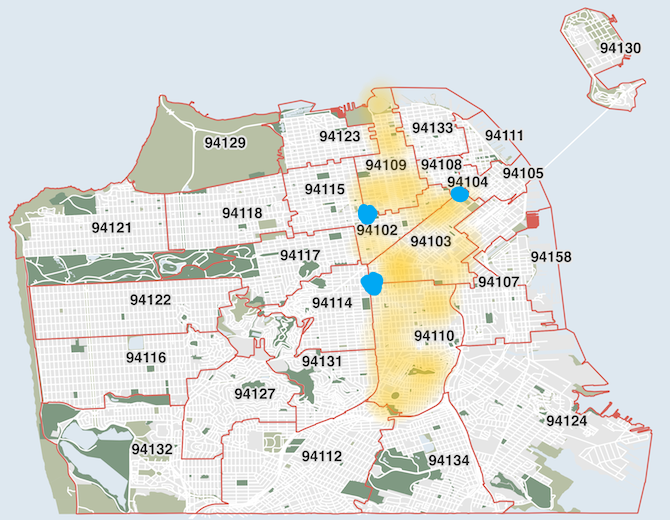
It's now clear that these four zipcodes- 94102, 94103, 94109, and 94110- require special attention. If I could specify locations of dispatch services freely, I'd want to allow emergency responders to cater efficiently to the high likelihood of emergencies in 94102 and 94103, as well as 94109 and 94110, and be sure that these services are always equipped for medical emergencies with ALS and paramedics, fires, and alarms- the most prominent cases.
→ With all this in mind, here are three dispatch services I would place, located in between these specific zipcodes for maximum range (marked in blue):
On Trains...
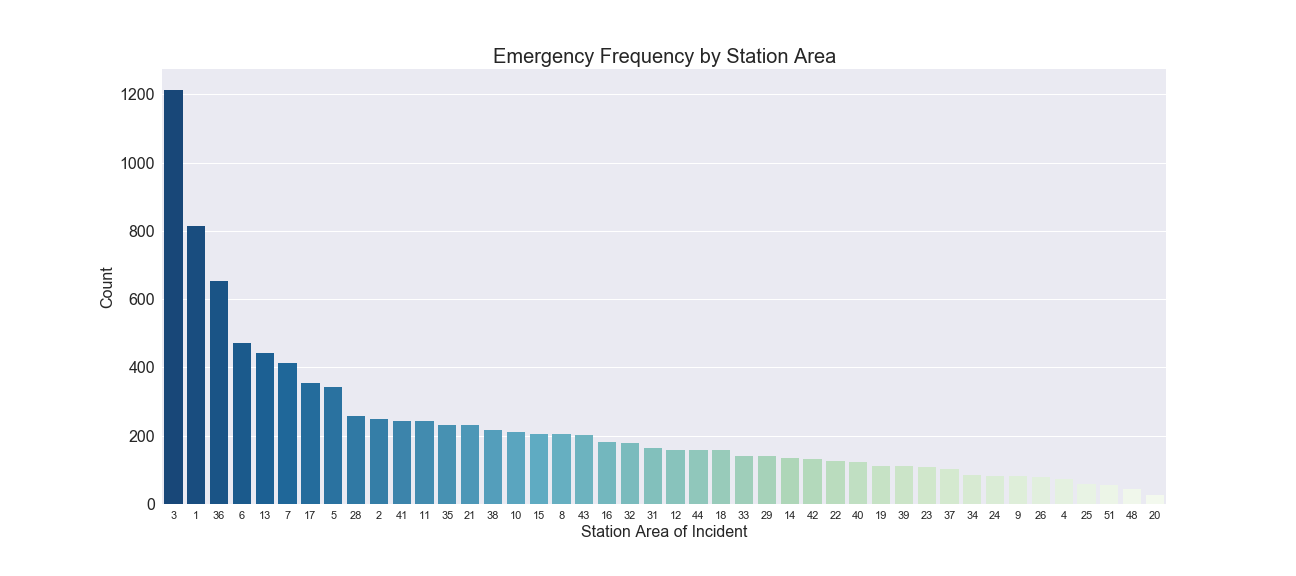
→ All 55 Train and Rail incidents occured in Station Area 13, zipcodes 94105 and 94111, so dispatchers there should be specifically ready for this type of emergency.
Shamikh Hossain
Contact information: ssh50@duke.edu